Home energy monitor reveals consumption horrors
I’ve moved flat recently (all planned, fancied an upgrade and the right opportunity came along), and my new flat is situated close to to the cupboard on my floor where the electricity meters are kept. This differs from previous apartment buildings in which I have lived because in those buildings the meters were all in the basement, far far away from the apartment itself. This prevented me from using an energy monitor, because for them to work you need to install a transmitter on the meter and that transmitter needs to be within a certain distance of the receiver inside the apartment.
Keen to work out why I kept getting over usage bills from my own employer, I bought an Owl Intuition-E and Micro+ bundle, which gave me the transmitter, the receiver and a network receiver, which allows me to upload usage data over the Internet to their online portal for analysis. Being within 30 metres of the meter, it works a treat.
I was a little surprised, however, with the results it gave me. I’ve found out the following:
- My television, surround sound and Bluray setup in the living room uses 60W on standby. 525 kWh per year (£78.75). I put a remote controlled socket on that lot straight away. I have no idea why 60W is necessary to keep four items AV equipment on standby.
- The TV / stereo setup in the bedroom uses 16W on standby. Another 140 kWh per year (£21.00) saved with another remote socket.
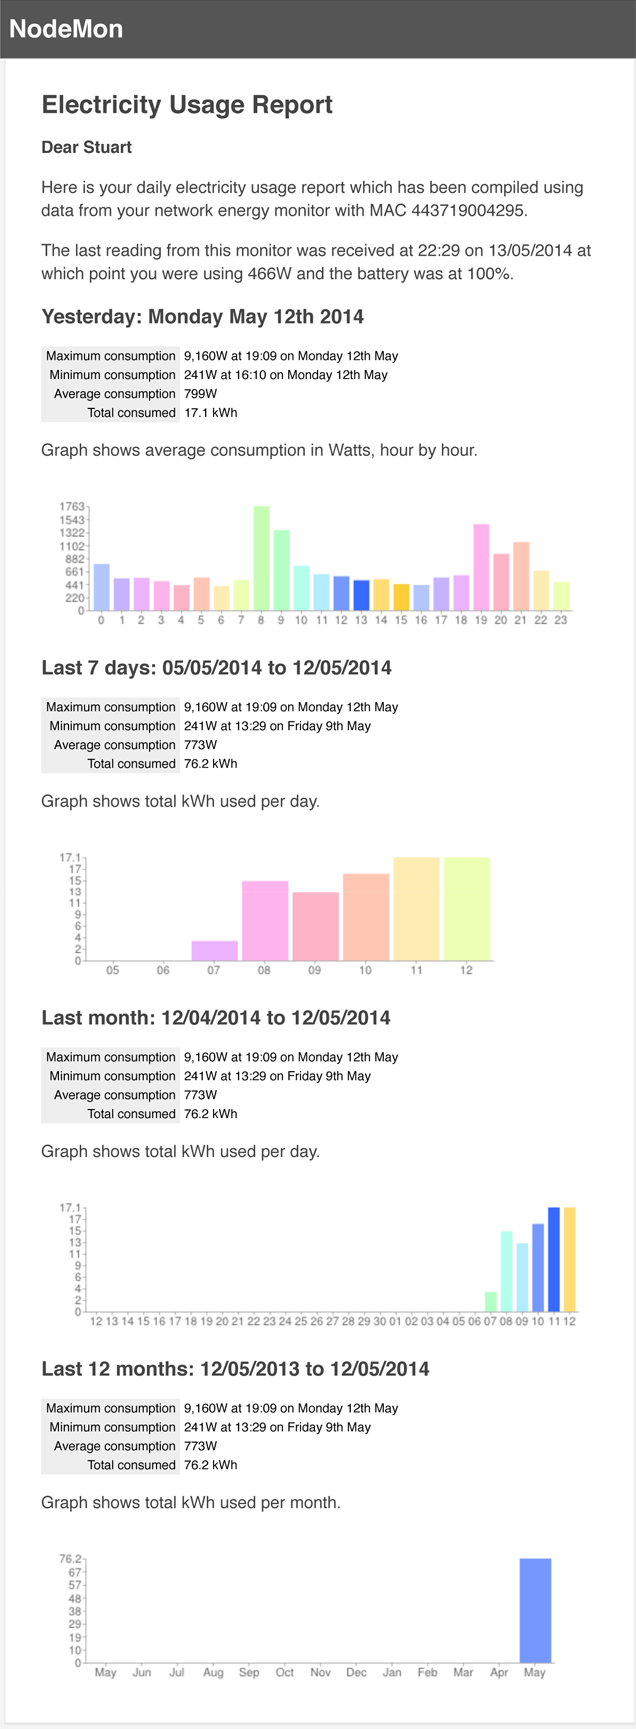
- I use a minimum of 241W. It never goes below that. This is during the day with no lights on (not that they bother me much, they’re all LED), with the fridge/freezer on (60W), my server and networking gear on (90W – this is lean, trust me) and my desktop computer on (60W), but with my monitors and everything else switched off. This means that there’s still 31W of background usage, 24 hours per day (271 kWh per year, £40.73).
- Consumption has been as high as > 9kW. This, presumably, was when I had the water heater and the cooker and the microwave and the telly on at the same time. Fortunately periods like this are always short-lived.
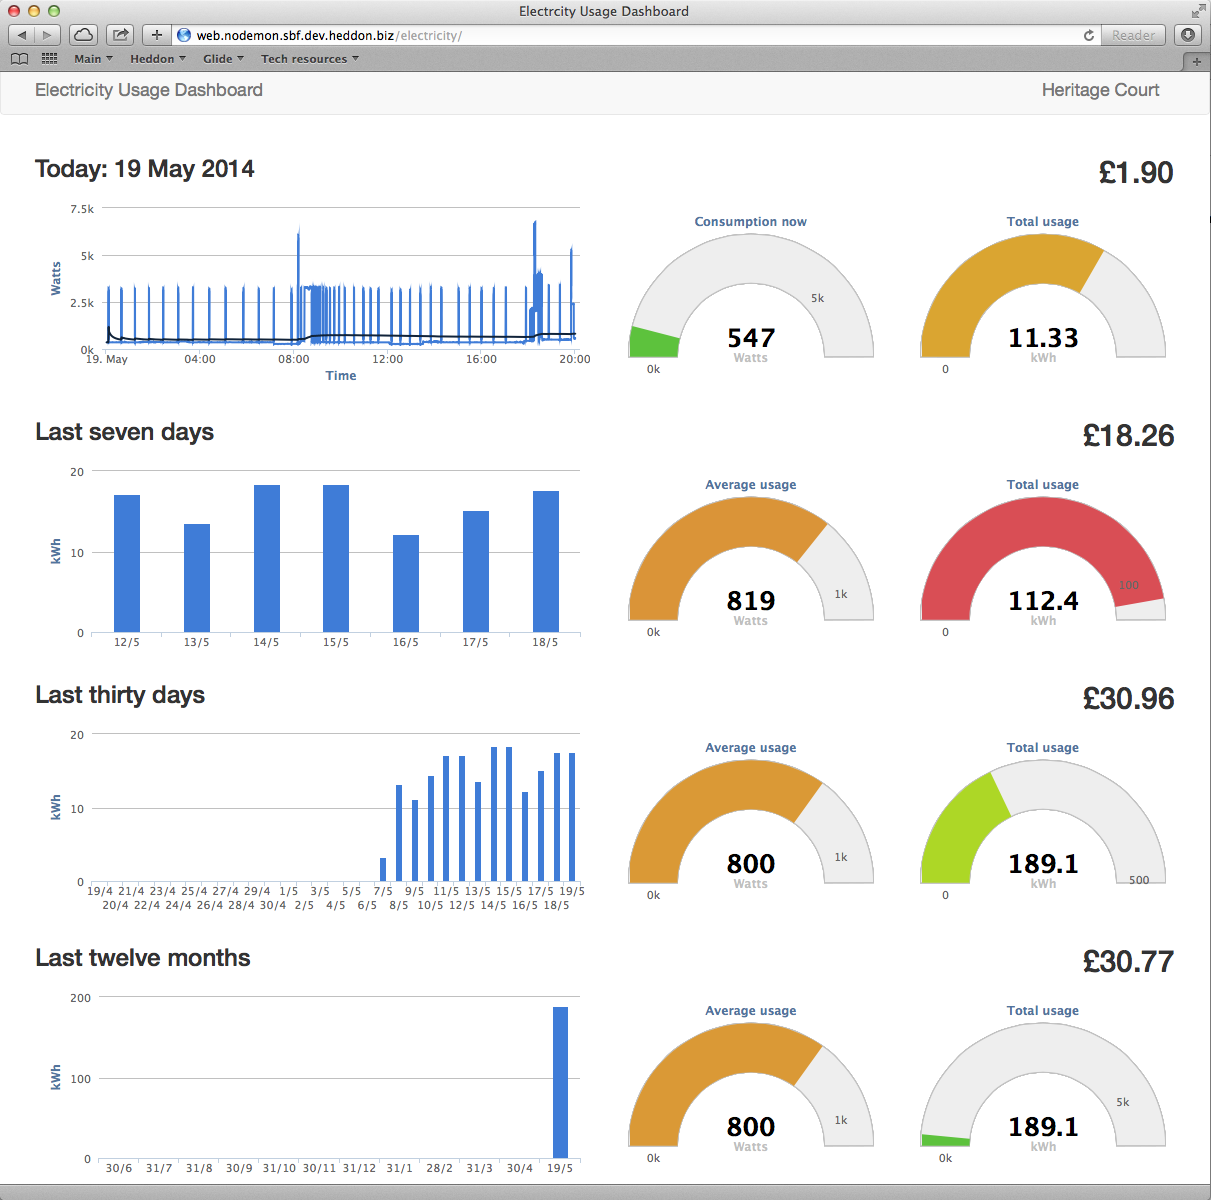
It’s a really good product, works very well, but I absolutely hate the web portal you have to log in to view your statistics. It’s awful. Fortunately, the network device can be configured to also sends its readings to a specified IP address on a specified UDP port, which is exactly what I’ve done and I store all my readings in a local database with a collector listening on that port. I then wrote my own software to analyse it and now I get a report like this every day. To this I have also added a web browser dashboard.
Update 19/05/2014: I’ve now created a web dashboard (which also works well on mobile devices).
Code’s here if you’re interested (NodeMon isn’t really a thing, just a project framework for various bits of tinkering). Needs Phalcon.

