MRTG Dashboard
I’m one of those die-hards whose been using MRTG for almost as long as I’ve had a computer with a network connection. It’s an old tool for monitoring network traffic and its not pretty by modern standards but it does still do that job very well. However, its blocky output does rather leave much to be desired in this day and age of interactivity and so I’ve knocked together an MRTG Dashboard.
It’s a single PHP script which you just pop in your MRTG output directory (workdir) on your PHP-enabled web server. That’s all you need, all the required libraries are loaded from CDNs. It’s not perfect, but it is an improvement.
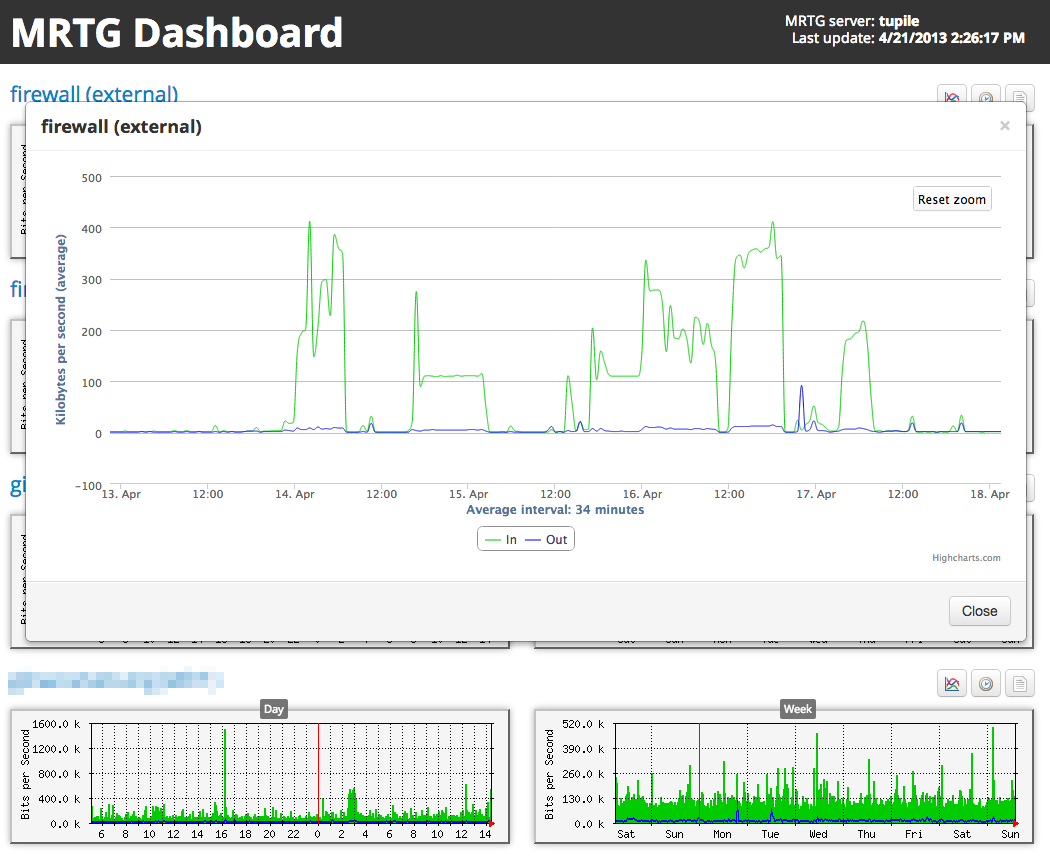
MRTG Dashboard screenshot
You will find that the timescales on the interactive graphs can be a little hit-and-miss. This is because while Highcharts demands data at consistent intervals when creating time-based graphs MRTG’s data is anything but consistently intervalled. I will try to improve this at some point in the future.
You can get MRTG Dashboard from Github.